AppSignal Integration
Send browser reports to AppSignal for centralized error tracking alongside your backend errors.
The AppSignal integration forwards W3C browser reports to AppSignal's error tracking, giving you a unified view of both frontend and backend issues. Browser reports appear as errors in your AppSignal dashboard, complete with report details and a link back to the full report in reporting-api.app.
Prerequisites
Before setting up the AppSignal integration, you'll need:
- An AppSignal account — Sign up for AppSignal if you don't have one
- A Front-end error monitoring API key — This is different from your backend Push API key
- A reporting-api.app application — With reports already flowing (see Getting Started)
Getting Your AppSignal API Key
To find your Front-end error monitoring API key:
- Log in to your AppSignal dashboard
- Select your application
- Navigate to App settings (gear icon)
- Click Push and deploy in the sidebar
- Find the Front-end error monitoring section
- Copy the API key shown there
Configuration
Step 1: Open Your Application Settings
In reporting-api.app, navigate to your application and click Edit to open the application settings. Scroll down to the Integrations section.
Step 2: Add AppSignal Integration
Click Add AppSignal to create a new AppSignal notification target. Enter your Front-end error monitoring API key in the form.
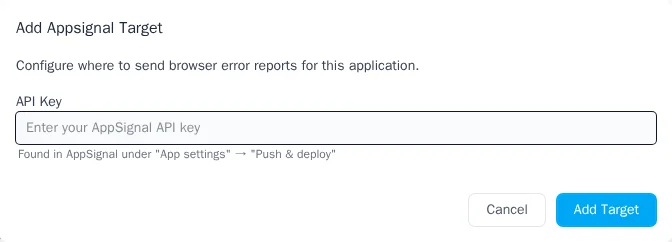
00000000-0000-0000-0000-000000000000
Your API key is encrypted at rest and never exposed in logs or the UI after saving.
Step 3: Configure Namespace (Optional)
By default, browser reports appear in the frontend namespace in AppSignal. You can customize this to
organize errors differently:
frontend— Default namespace for browser errorsweb— Group with your web application errors- Custom value — Any string to create a dedicated namespace
Namespaces help you filter and organize errors in AppSignal's dashboard. Choose a namespace that fits your team's workflow.
Step 4: Enable the Integration
After saving, ensure the integration is enabled. You can toggle integrations on and off without losing your configuration.
How Reports Appear in AppSignal
When a browser report arrives, reporting-api.app transforms it into an AppSignal error format and sends it to AppSignal's public endpoint.
Error Name Mapping
Browser report types are mapped to descriptive error names in AppSignal:
| Report Type | AppSignal Error Name |
|---|---|
csp-violation |
CSPViolation |
deprecation |
DeprecationWarning |
intervention |
BrowserIntervention |
integrity-violation |
IntegrityViolation |
| Other types |
TitleCased version (e.g., crash-report → CrashReport)
|
Payload Structure
Each report is sent to AppSignal with the following structure:
{
  "namespace": "frontend",
  "timestamp": 1734012345,
  "error": {
    "name": "CSPViolation",
    "message": "{ full report body as JSON }"
  },
  "tags": {
    "report_type": "csp-violation",
    "report_url": "https://reporting-api.app/organizations/.../reports/..."
  }
}
Payload Fields
| Field | Description |
|---|---|
namespace |
Your configured namespace (default: frontend) |
timestamp |
Unix timestamp when the report was received |
error.name |
Mapped error name (see table above) |
error.message |
Complete report body as pretty-printed JSON |
tags.report_type |
Original report type for filtering in AppSignal |
tags.report_url |
Direct link to the full report in reporting-api.app |
Example: CSP Violation in AppSignal
Here's how a CSP violation report appears when sent to AppSignal:
{
  "namespace": "frontend",
  "timestamp": 1734012345,
  "error": {
    "name": "CSPViolation",
    "message": "{\n  \"blockedURL\": \"https://evil.com/malicious.js\",\n  \"effectiveDirective\": \"script-src-elem\",\n  \"disposition\": \"enforce\",\n  \"documentURL\": \"https://example.com/checkout\",\n  \"originalPolicy\": \"default-src 'self'; script-src 'self'; report-to default\"\n}"
  },
  "tags": {
    "report_type": "csp-violation",
    "report_url": "https://reporting-api.app/organizations/abc123/reports/456"
  }
}
In AppSignal, this appears as an error named CSPViolation in your frontend namespace. The
report_url tag lets you click through to see the full report details in reporting-api.app.
Troubleshooting
Reports Not Appearing in AppSignal
- Check the integration is enabled — In your application settings, verify the AppSignal integration toggle is on
- Verify your API key — AppSignal's endpoint doesn't validate API keys in real-time (it returns 200 OK regardless). If reports aren't appearing, double-check you copied the correct Front-end error monitoring key
- Check AppSignal's error count — In AppSignal, look at your error counts to confirm reports are being received. If the count isn't increasing, the API key may be incorrect
- Wait a moment — AppSignal may take a few seconds to process and display new errors
Wrong Namespace
- Check your configuration — Edit the AppSignal integration and verify the namespace setting
-
Default is
frontend— If you don't see your configured namespace, reports may be using the default
API Key Security
- Key is encrypted — Your API key is encrypted at rest and never logged. After saving, the UI shows a placeholder instead of the actual key
- Updating the key — To change your API key, enter the new key in the field. Leave it blank to keep the existing key
Next Steps
- Webhooks — Send reports to custom HTTP endpoints
- Google Chat — Get alerts in Google Chat spaces
- CSP Violations — Configure Content Security Policy reporting
Resources
- AppSignal JavaScript documentation — Official AppSignal frontend monitoring docs
- AppSignal errors endpoint API — Technical reference for the errors endpoint