Getting Started
Get up and running with reporting-api.app in minutes. This guide walks you through the essential steps to start capturing browser reports from your web application.
Step 1: Create an Account
Sign up for a free account to get started. No credit card required — just your email address.
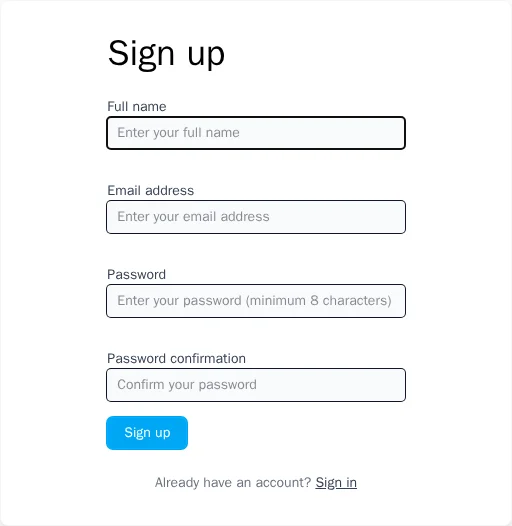
After signing up, you'll receive a verification email. Click the link to verify your email address and activate your account.
Step 2: Create Your First Application
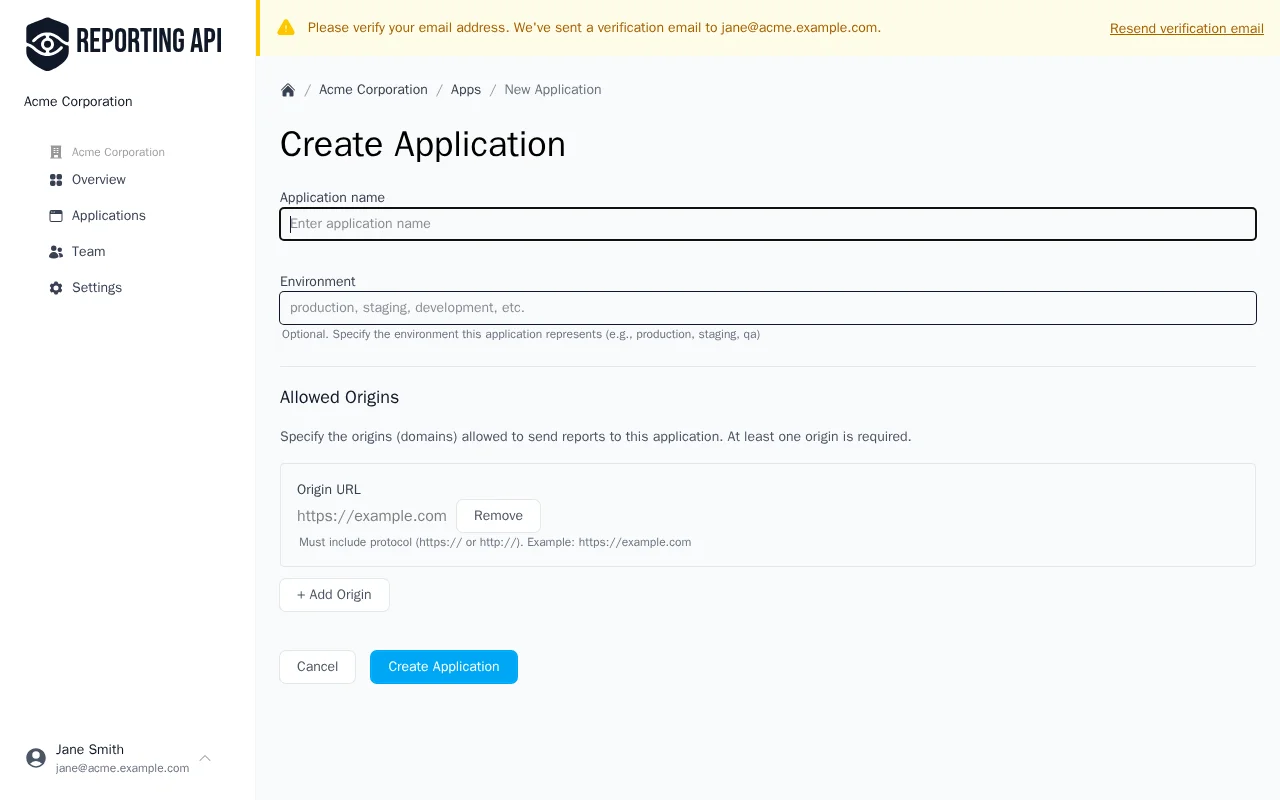
Once signed in, you'll see your organization dashboard. Click "New Application" to create your first application.
Give your application a descriptive name (e.g., "Production Website" or "Staging Environment") and select the environment type. This helps you organize reports from different deployments.
After creating the application, you'll see your unique reporting endpoint URL. This URL is where browsers will send reports. It looks like:
https://reporting-api.app/browser-reports/YOUR-UNIQUE-UUID
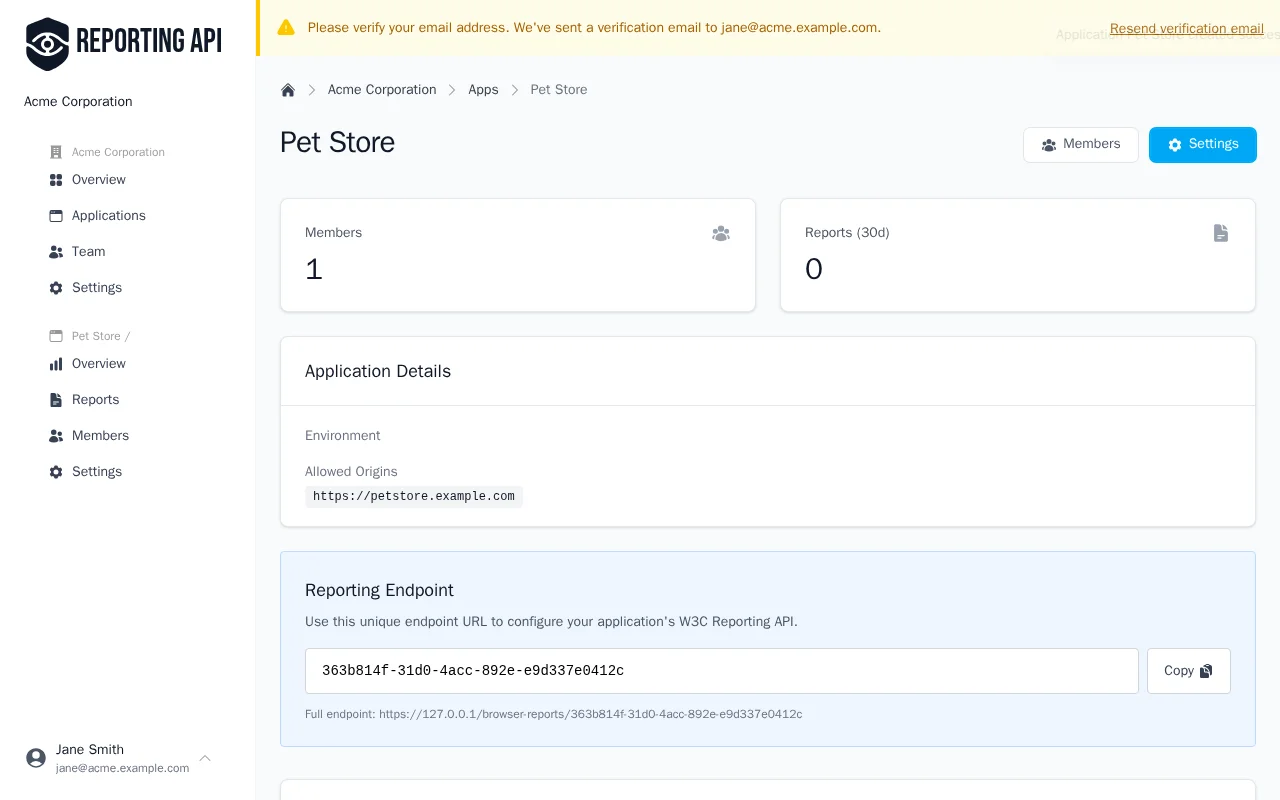
Copy this URL — you'll need it in the next step.
Configure Allowed Origins
For security, you must whitelist the origins (domains) that are allowed to send reports. Add your website's origin in the application settings:
https://example.com
https://www.example.com
Reports from unlisted origins will be rejected with a 403 Forbidden response.
Step 3: Configure HTTP Headers
The W3C Reporting API uses HTTP headers to configure where browsers send reports. Add these headers to your server responses.
Basic Setup
First, define your reporting endpoint using the Reporting-Endpoints header:
Reporting-Endpoints: default="https://reporting-api.app/browser-reports/YOUR-UUID"
The default endpoint automatically receives deprecation warnings, browser interventions, and crash
reports. For CSP violations, you'll also need to configure the policy header.
Content Security Policy with Reporting
To receive CSP violation reports, add the report-to directive to your Content-Security-Policy header:
Content-Security-Policy: default-src 'self'; script-src 'self'; report-to default
Firefox Compatibility
Firefox doesn't yet support the Reporting-Endpoints header. For Firefox compatibility, add the legacy
report-uri directive alongside report-to:
Reporting-Endpoints: default="https://reporting-api.app/browser-reports/YOUR-UUID"
Content-Security-Policy: default-src 'self'; script-src 'self'; report-to default; report-uri https://reporting-api.app/browser-reports/YOUR-UUID
Modern browsers use report-to while Firefox falls back to report-uri.
Server Configuration Examples
Nginx
server {
    # ... your existing configuration ...

    # Add reporting headers to all responses
    add_header Reporting-Endpoints 'default="https://reporting-api.app/browser-reports/YOUR-UUID"' always;
    add_header Content-Security-Policy "default-src 'self'; script-src 'self'; report-to default; report-uri https://reporting-api.app/browser-reports/YOUR-UUID" always;
}
Ruby on Rails
Rails has built-in CSP support. Configure it in an initializer:
Rails.application.config.content_security_policy do |policy|
  policy.default_src :self
  policy.script_src  :self

  # Legacy report-uri for Firefox
  policy.report_uri "https://reporting-api.app/browser-reports/YOUR-UUID"
end

# Add Reporting-Endpoints header for modern browsers
# Note: Use lowercase header names for Rack 3 compatibility
Rails.application.config.action_dispatch.default_headers.merge!(
  "reporting-endpoints" => 'default="https://reporting-api.app/browser-reports/YOUR-UUID"'
)
Note: Rails doesn't yet support the report-to directive natively. See
Rails PR #52367 for
progress on this feature.
Step 4: Verify Reports Are Flowing
After configuring your headers, verify that reports are being received:
- Deploy your header changes to your web server
- Visit your website in a browser
- Check your application dashboard in reporting-api.app
Trigger a Test Violation
To quickly test your setup, you can trigger a CSP violation intentionally. Add this inline script to a test page (it will be blocked by your CSP):
<!DOCTYPE html>
<html>
<head>
  <title>CSP Test</title>
</head>
<body>
  <h1>CSP Violation Test</h1>
  <!-- This inline script will be blocked if script-src doesn't allow 'unsafe-inline' -->
  <script>console.log('This should trigger a CSP violation report');</script>
</body>
</html>
If your CSP blocks inline scripts (as it should), this will generate a violation report that appears in your dashboard within seconds.
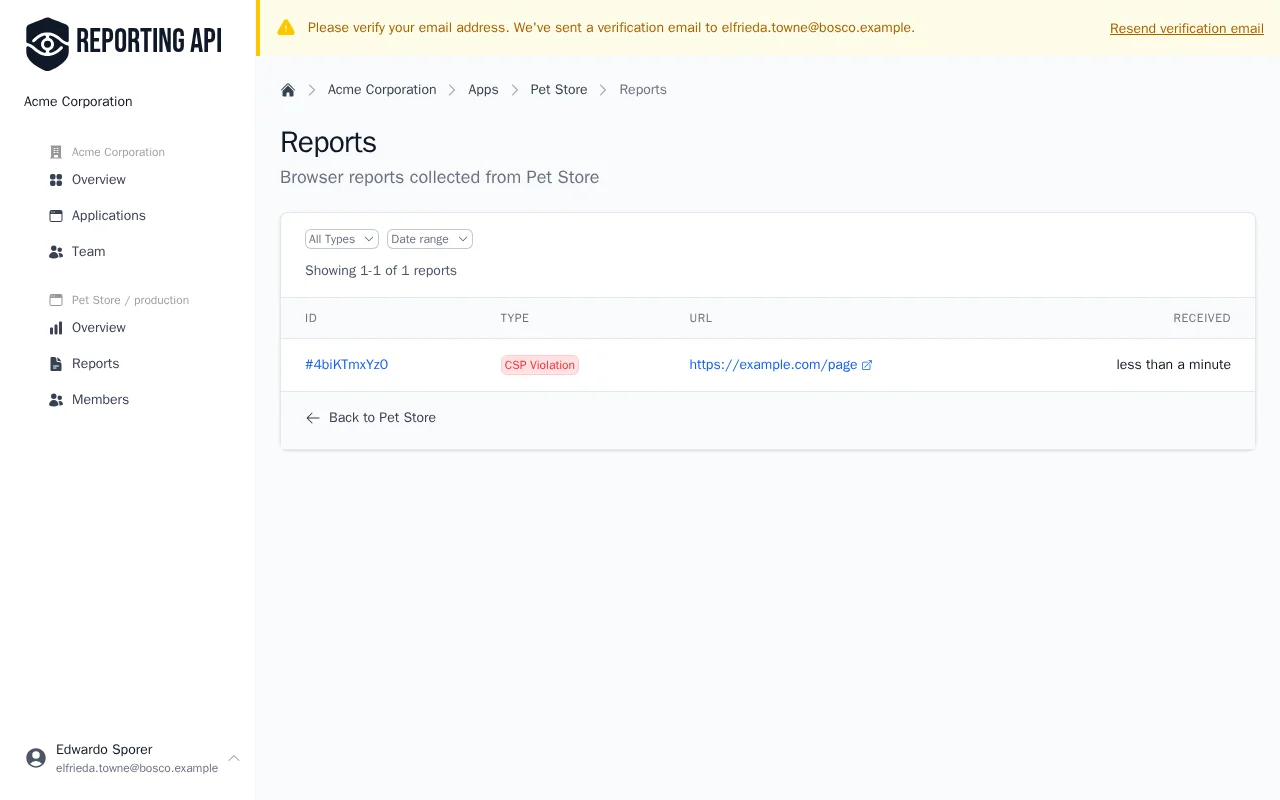
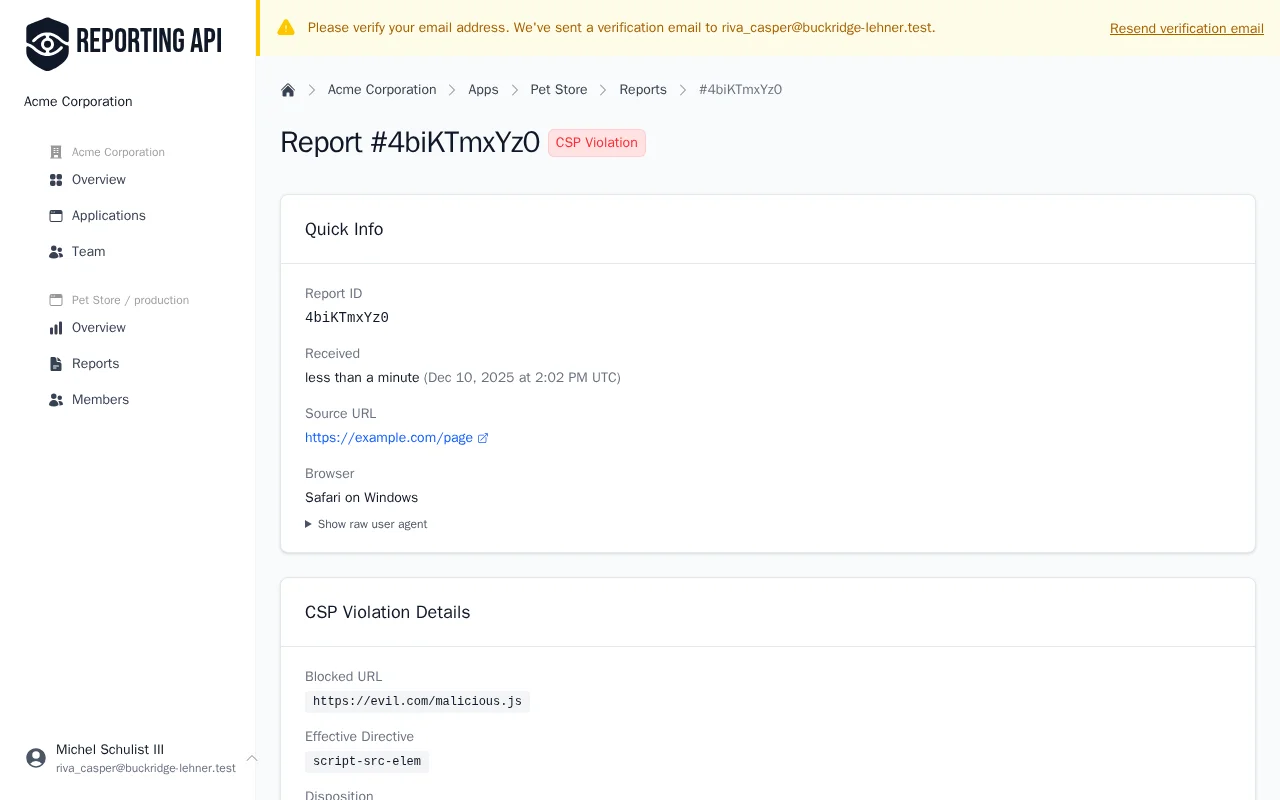
Click on any report to view its full details, including the blocked URL, directive violated, and source location.
Troubleshooting
If reports aren't appearing:
- Check allowed origins — Ensure your website's origin is whitelisted
- Verify headers — Use browser DevTools (Network tab) to confirm headers are present
- Check browser console — CSP violations appear in the console with details
- Wait a moment — Browsers may batch reports; allow 30-60 seconds
Step 5: Set Up Notifications
Once reports are flowing, configure notifications to alert your team in real-time. Navigate to your application's settings and add a notification target:
- AppSignal — Route reports to AppSignal's frontend monitoring
- Webhooks — Send reports to any HTTP endpoint (Slack, Discord, custom services)
- Google Chat — Post reports directly to Google Chat spaces
See the Integrations documentation for detailed setup instructions.
Next Steps
Now that you're capturing browser reports, explore the different report types you can monitor:
- CSP Violations — Content Security Policy violations
- Deprecations — Deprecated API usage warnings
- Interventions — Browser intervention reports
- Crash Reports — Tab crashes and out-of-memory events
Each report type has specific header configuration requirements documented in its respective guide.